After building the job search agent with DeepAgent, I wanted to push the framework further. This time: a conversational data analyst. Upload a CSV or Excel file, ask questions in natural language, and get back stats, charts, dashboards, and reports.
What It Does
A multi-user chat app where you upload data files and have a conversation about them. Ask “show me the distribution of sales by region” and the agent generates an interactive Plotly chart. Ask “give me a summary of this dataset” and it runs profiling, summary stats, outlier detection.
The agent handles CSV and Excel files. It generates interactive Plotly charts (HTML/JSON), static matplotlib/seaborn charts (PNG), self-contained HTML dashboards, and PDF reports. Everything is downloadable and shareable.
The Agent Architecture
Same DeepAgent foundation as the job search agent, but with more specialized tooling. The orchestrator agent coordinates two subagents:
- Stats Researcher - Handles descriptive analytics. Profiling, summary stats, groupby, crosstab, outlier flags. Takes a dataset and a question, returns structured analysis.
- Chart Maker - Handles visualization. Decides whether to use Plotly (interactive) or matplotlib/seaborn (static) based on what makes sense for the request.
The orchestrator decides which subagent to call based on the user’s question. Sometimes both. “Analyze sales trends and show me a chart” triggers the stats researcher first, then passes context to the chart maker.
12 custom tools registered on the harness — loaders, query runners, chart generators, dashboard builders. The subagents each get access to the tools relevant to their role.
Backend Design
The harness uses different backends depending on the environment:
- LocalShellBackend — The default. Rooted at a workspace directory with a sandboxed virtual filesystem. Used when Supabase is not configured.
- CompositeBackend — Used when Supabase is enabled. Routes between two sub-backends: a StateBackend for ephemeral runtime state, and a StoreBackend routed to
/memories/for persistent cross-session memory backed by LangGraph’s Store.
The Store itself switches between PostgresStore (production, backed by Supabase’s direct DB connection) and InMemoryStore (dev fallback). This means long-term memory works in both environments — it just does not survive restarts in dev mode.
The agent also loads AGENTS.md files as memory paths, giving each subagent persistent context about its role and capabilities. Conversation state is checkpointed with LangGraph’s MemorySaver, so the agent can resume mid-conversation without losing context.
Data Tooling
This was the most interesting part. Building tools that let an AI agent do real data analysis required thinking about what operations are useful and how to structure their outputs.
The loader tool handles CSV and Excel ingestion with type inference and basic cleaning. The analysis tools cover the common descriptive stats workflow: profiling, groupby aggregations, crosstab, outlier detection. The visualization tools generate both interactive and static charts.
For dashboards and reports, the agent uses Jinja2 templates to assemble self-contained HTML files. The dashboards include multiple charts and summary tables in a single page. Reports add narrative sections alongside the data.
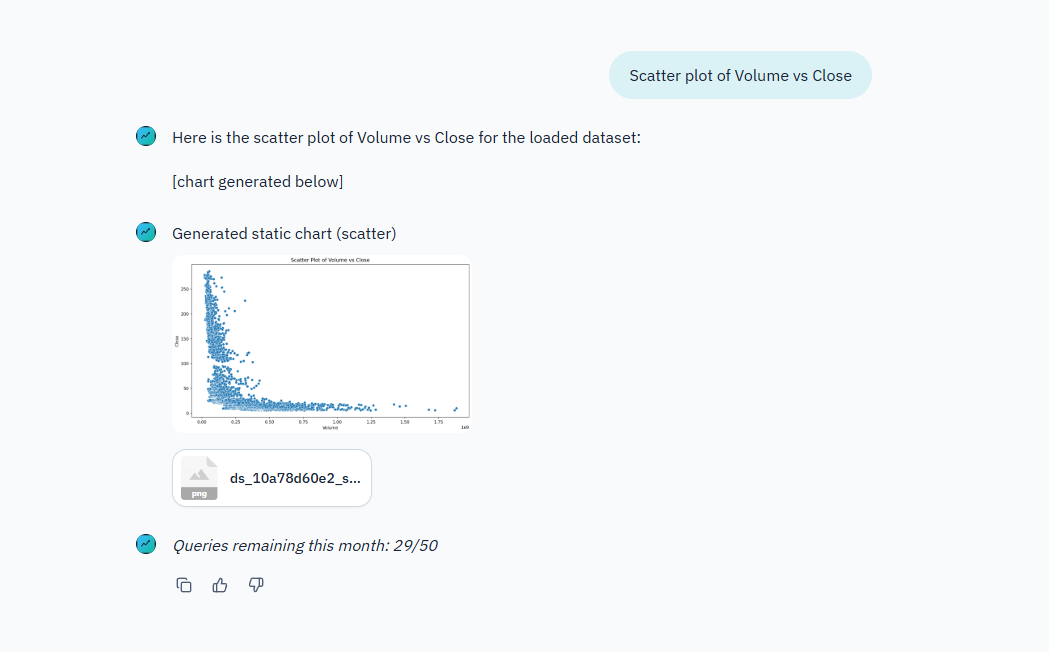
Static charts get rendered inline in the chat as PNG previews. Interactive Plotly charts are saved as HTML files you can open in a browser with full interactivity (zoom, hover, filter).
Multi-User with Supabase
The app supports multiple users through Supabase. Email/password auth, per-user rate limiting (50 queries/month on free tier), dataset persistence across sessions, and chat history. Users can reload datasets from previous sessions without re-uploading.
When Supabase is not configured, the app runs in local-only mode. No login, no limits, no persistence. Good for development and single-user use.
Deployment
Chainlit for the chat UI. Docker Compose for deployment. Custom branding with themed login page, logos, and CSS overrides.
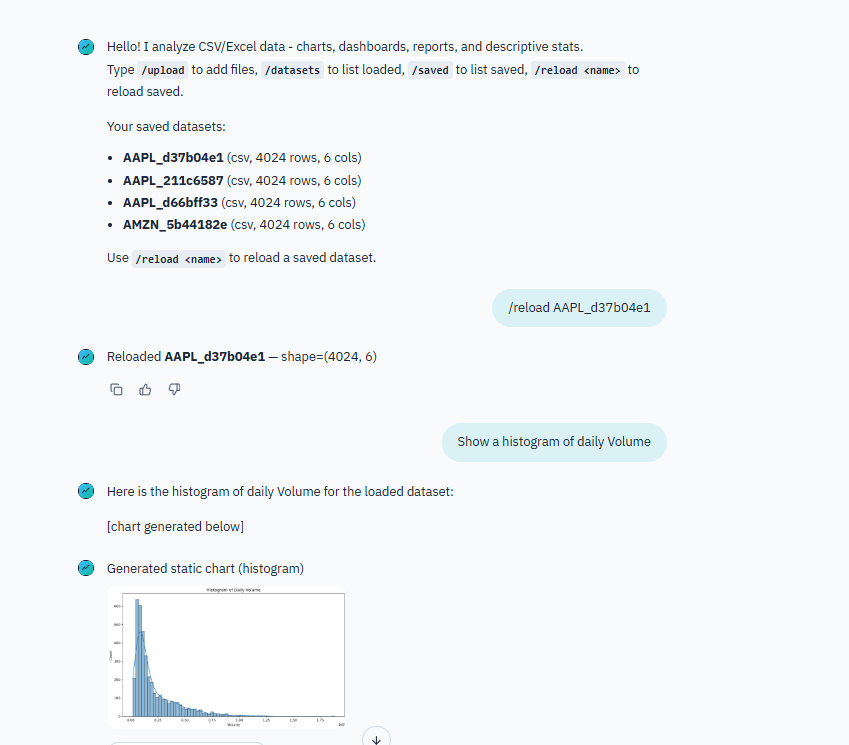
Chat commands (/upload, /datasets, /saved, /reload) give users quick access to file management without typing full sentences.
What I Learned
Building data analysis tools for an AI agent is different from building a data analysis library. The tools need to return results in a format the agent can reason about and present to the user. A raw pandas DataFrame dump does not work. The agent needs structured summaries it can interpret and explain.
The subagent pattern scales well. Adding new capabilities means adding new subagents or tools without touching the orchestrator logic. The stats researcher and chart maker are independent. Could add a “report writer” subagent later without changing anything else.
Plotly was the right choice for interactive charts. The agent generates the chart spec, Plotly renders it, and the user gets a fully interactive visualization they can explore. Much more useful than a static image for data exploration.